Additional options available in the `jointVIP` package
Source:vignettes/additional_options.Rmd
additional_options.RmdSetting up to demonstrate jointVIP
See the Get started with jointVIP vignette to get started on how to
use jointVIP package. Using the same data sets, this
vignette’s main purpose is to demonstrate other options that are
available.
library(jointVIP)

# gentle reminder of how to create a new jointVIP object
new_jointVIP = create_jointVIP(treatment = treatment,
                               outcome = outcome,
                               covariates = covariates,
                               pilot_df = pilot_df,
                               analysis_df = analysis_df)

# gentle reminder of how to create a new post_jointVIP object
post_optmatch_jointVIP = create_post_jointVIP(new_jointVIP,
                                             post_analysis_df = optmatch_df)
Demonstration for additional options in summary() and
print()
# # simplest usage
# summary(new_jointVIP)

summary(new_jointVIP,
        smd = 'pooled',
        use_abs = FALSE,
        bias_tol = 0.005)
#> Max bias is 0.093
#> Min bias is -0.003
#> 4 variables are above the desired 0.005 absolute bias tolerance
#> 8 variables can be plotted

print(new_jointVIP,
      smd = 'pooled',
      use_abs = FALSE,
      bias_tol = 0.005)
#>           bias
#> log_re75 0.093
#> log_re74 0.038
#> marr     0.007
#> nodegree 0.005

# not run
# get_measures(new_jointVIP, smd = 'cross-sample')
The summary() and print() functions have
the same additional parameters and uses rounded numbers to the third
decimal place.
The
smdparameter allows onlypooledorcross-sampleoptions. The cross-sample is based on the analysis sample numerator and pilot sample denominator (equivalent to standardized version of the one-sample omitted variable bias). The cross-sample version is the default. The pooled version of the standardized mean difference (standard) can be specified. Thepooledoption is the standard option used in balance tables and Love plots that uses both treated and control variances from the analysis data set to construct the SMD. Note thispooledoption applies the same formula to both binary and continuous variables.The
use_absparameter takes in either TRUE or FALSE, stating if set TRUE (default), the absolute measures are used. Otherwise, signed measured are used if set to be FALSE.The
bias_tolparameter is to set the absolute bias tolerance that one wishes to examine at a glance. The default is 0.01.
Under the hood, get_measures() function is used to
calculate. If the researcher wishes to save the measures calculated,
perhaps get_measures() would be used; example is shown
above. Only signed measures are presented as outputs for that
function.
Demonstration for additional options in plot()
# # simplest usage
# plot(new_jointVIP)

plot(new_jointVIP,
     smd = 'pooled',
     use_abs = FALSE,
     plot_title = 'Signed version of the jointVIP with pooled SMD')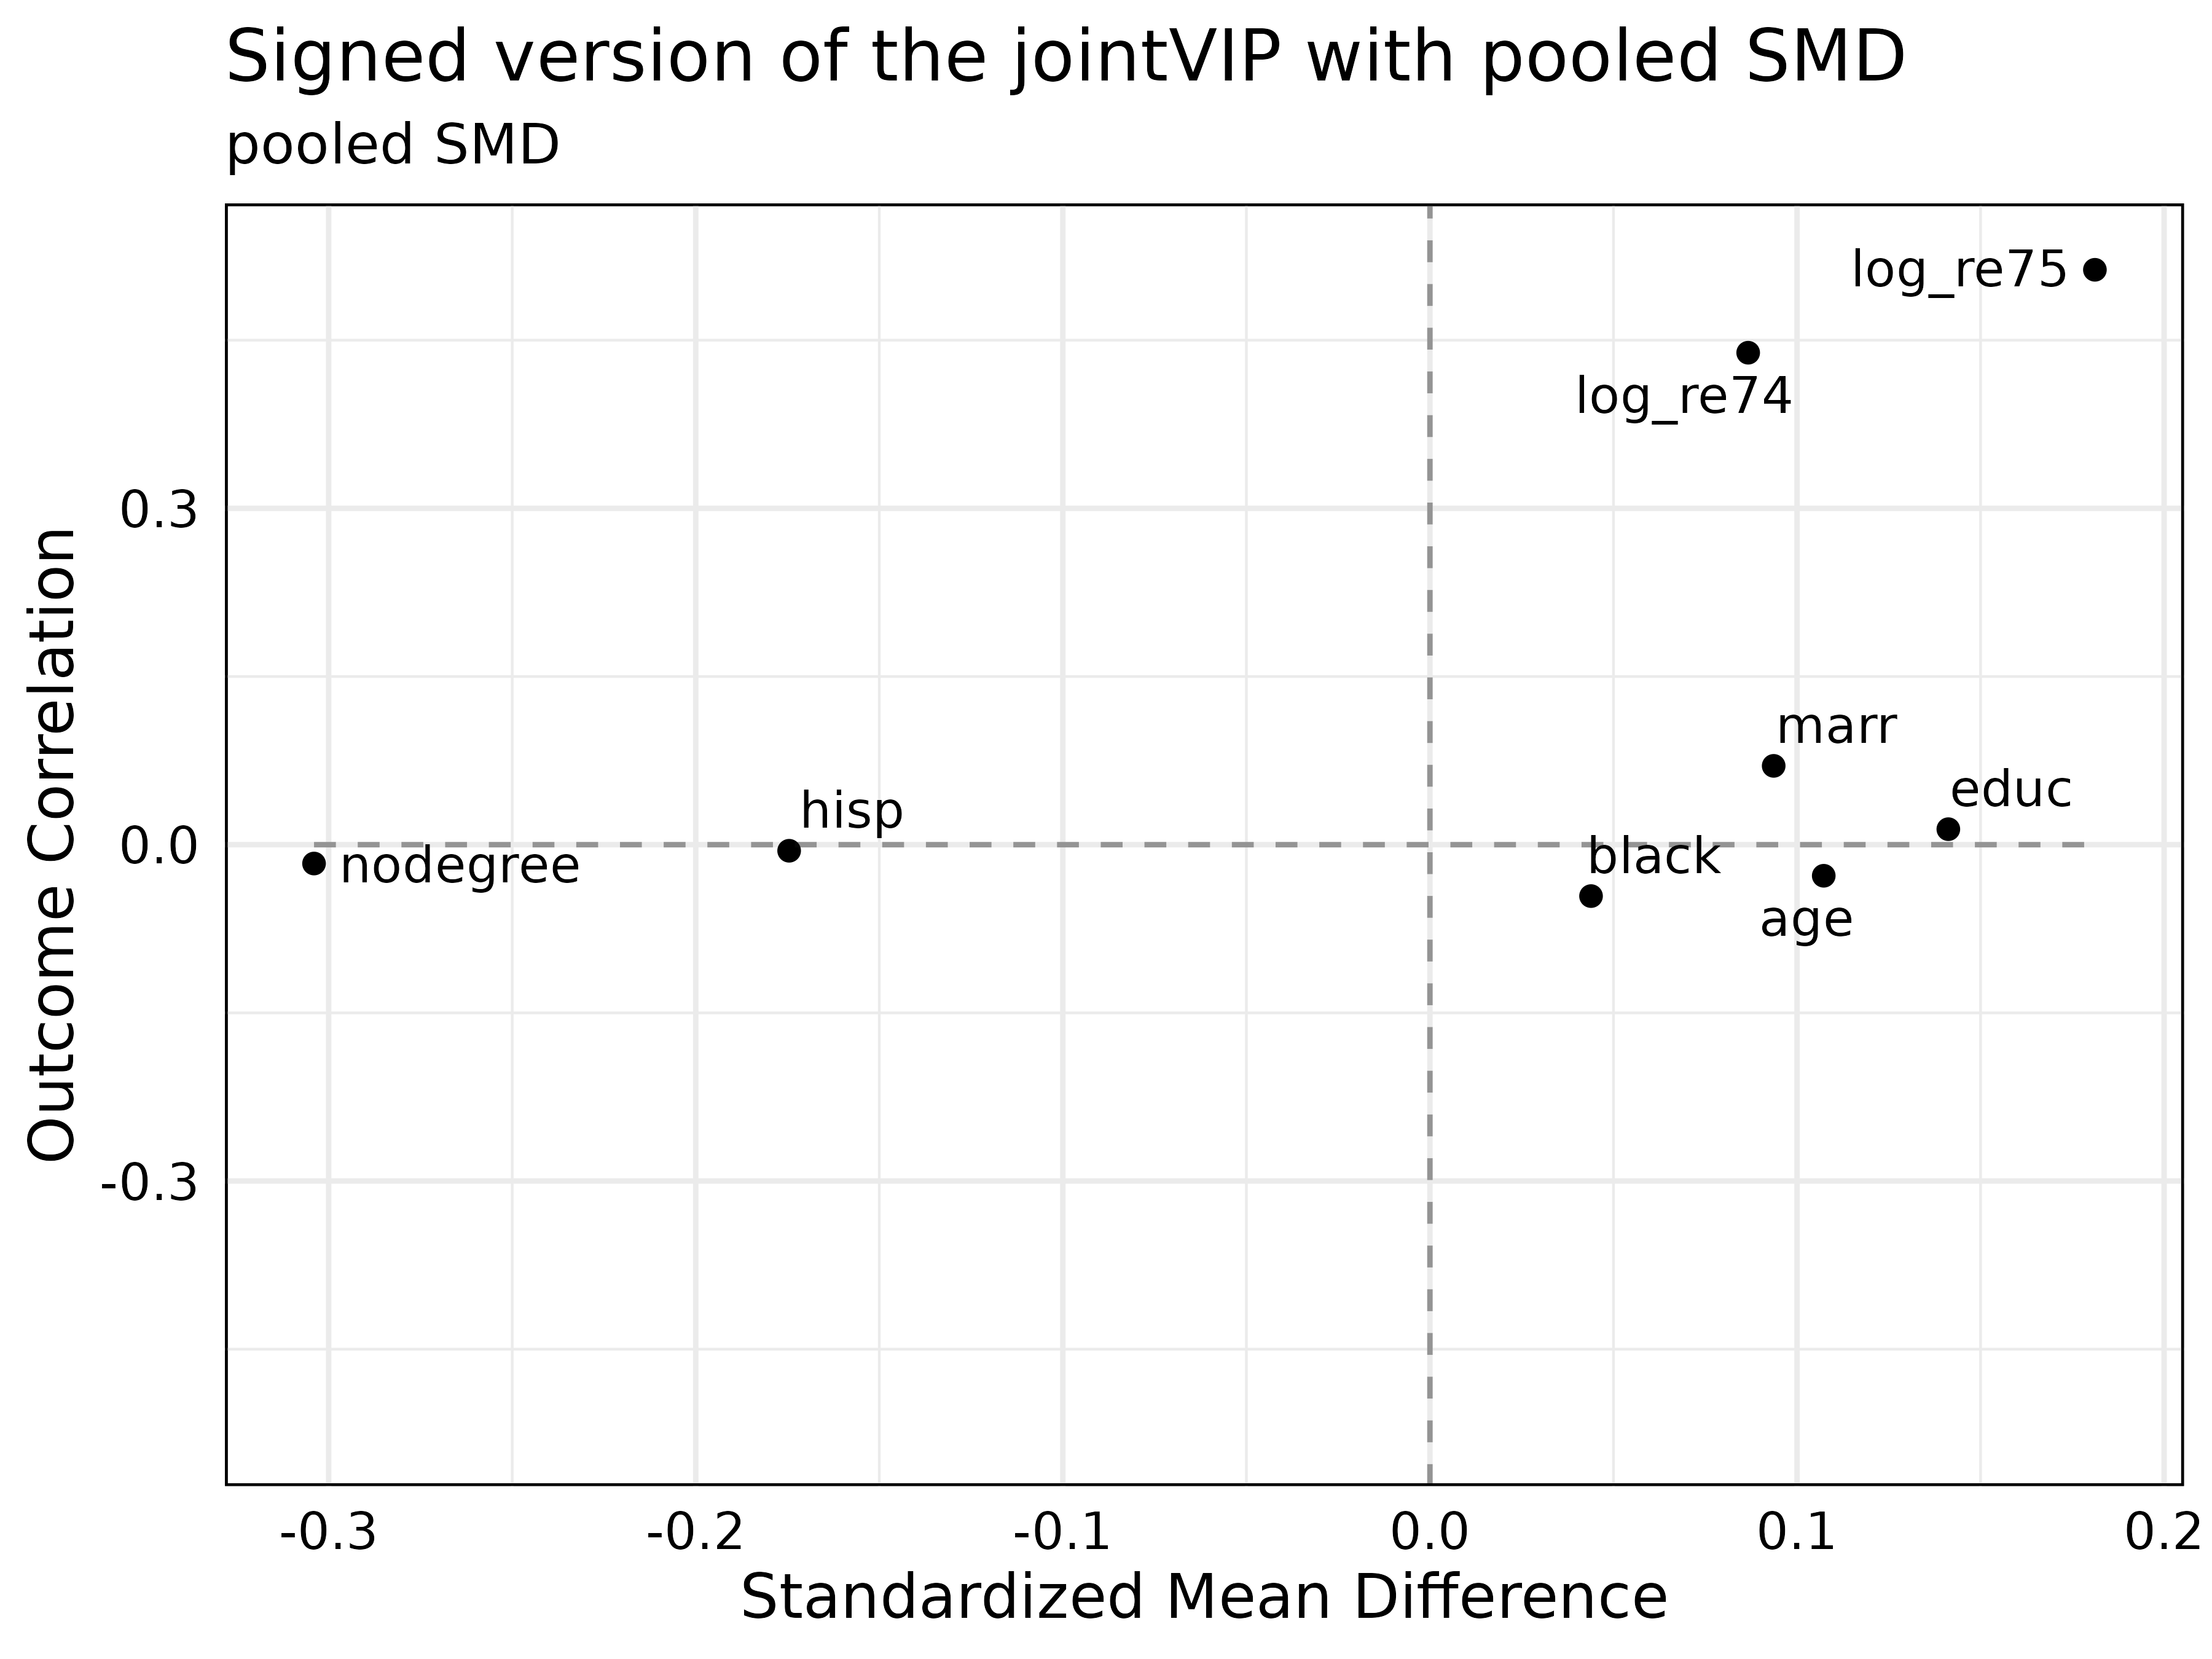
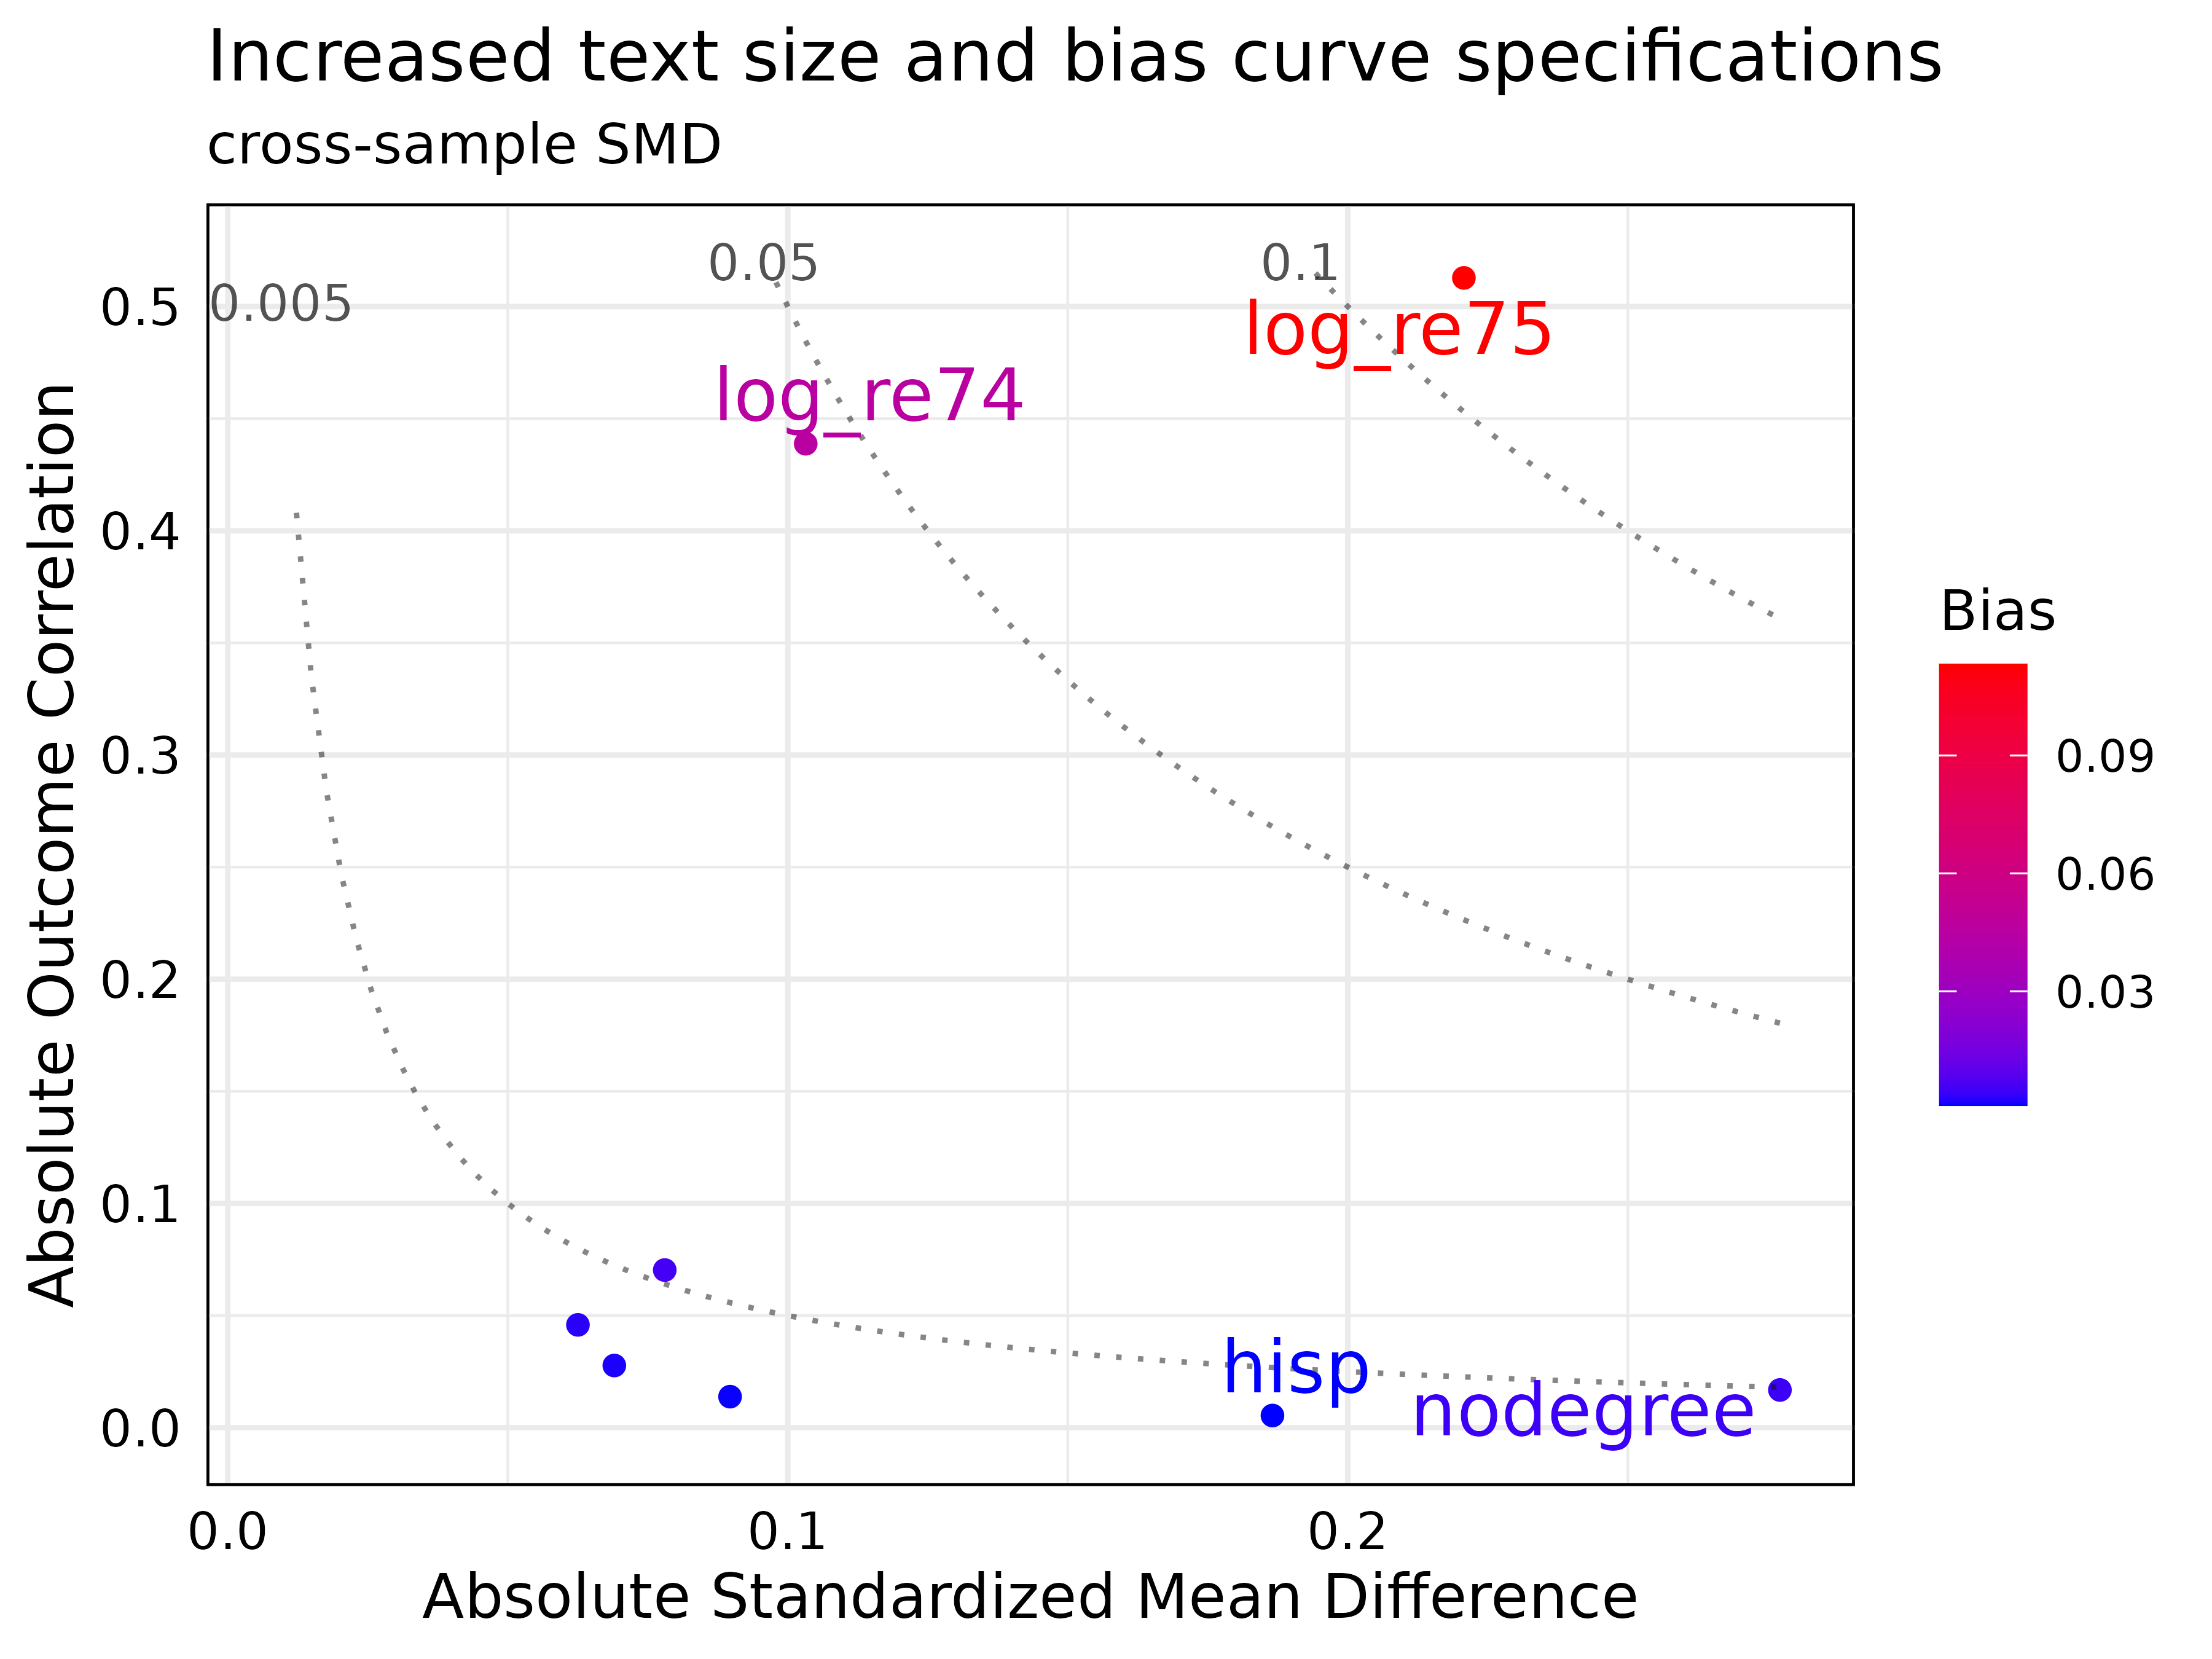
plot(new_jointVIP,
     bias_curve_cutoffs = c(0.005, 0.05, 0.10),
     text_size = 5,
     label_cut_std_md = 0.1,
     max.overlaps = 15,
     plot_title = 'Increased text size and bias curve specifications',
     expanded_y_curvelab = 0.002
     #label_cut_outcome_cor = 0.2,
     #label_cut_bias = 0.1
     )
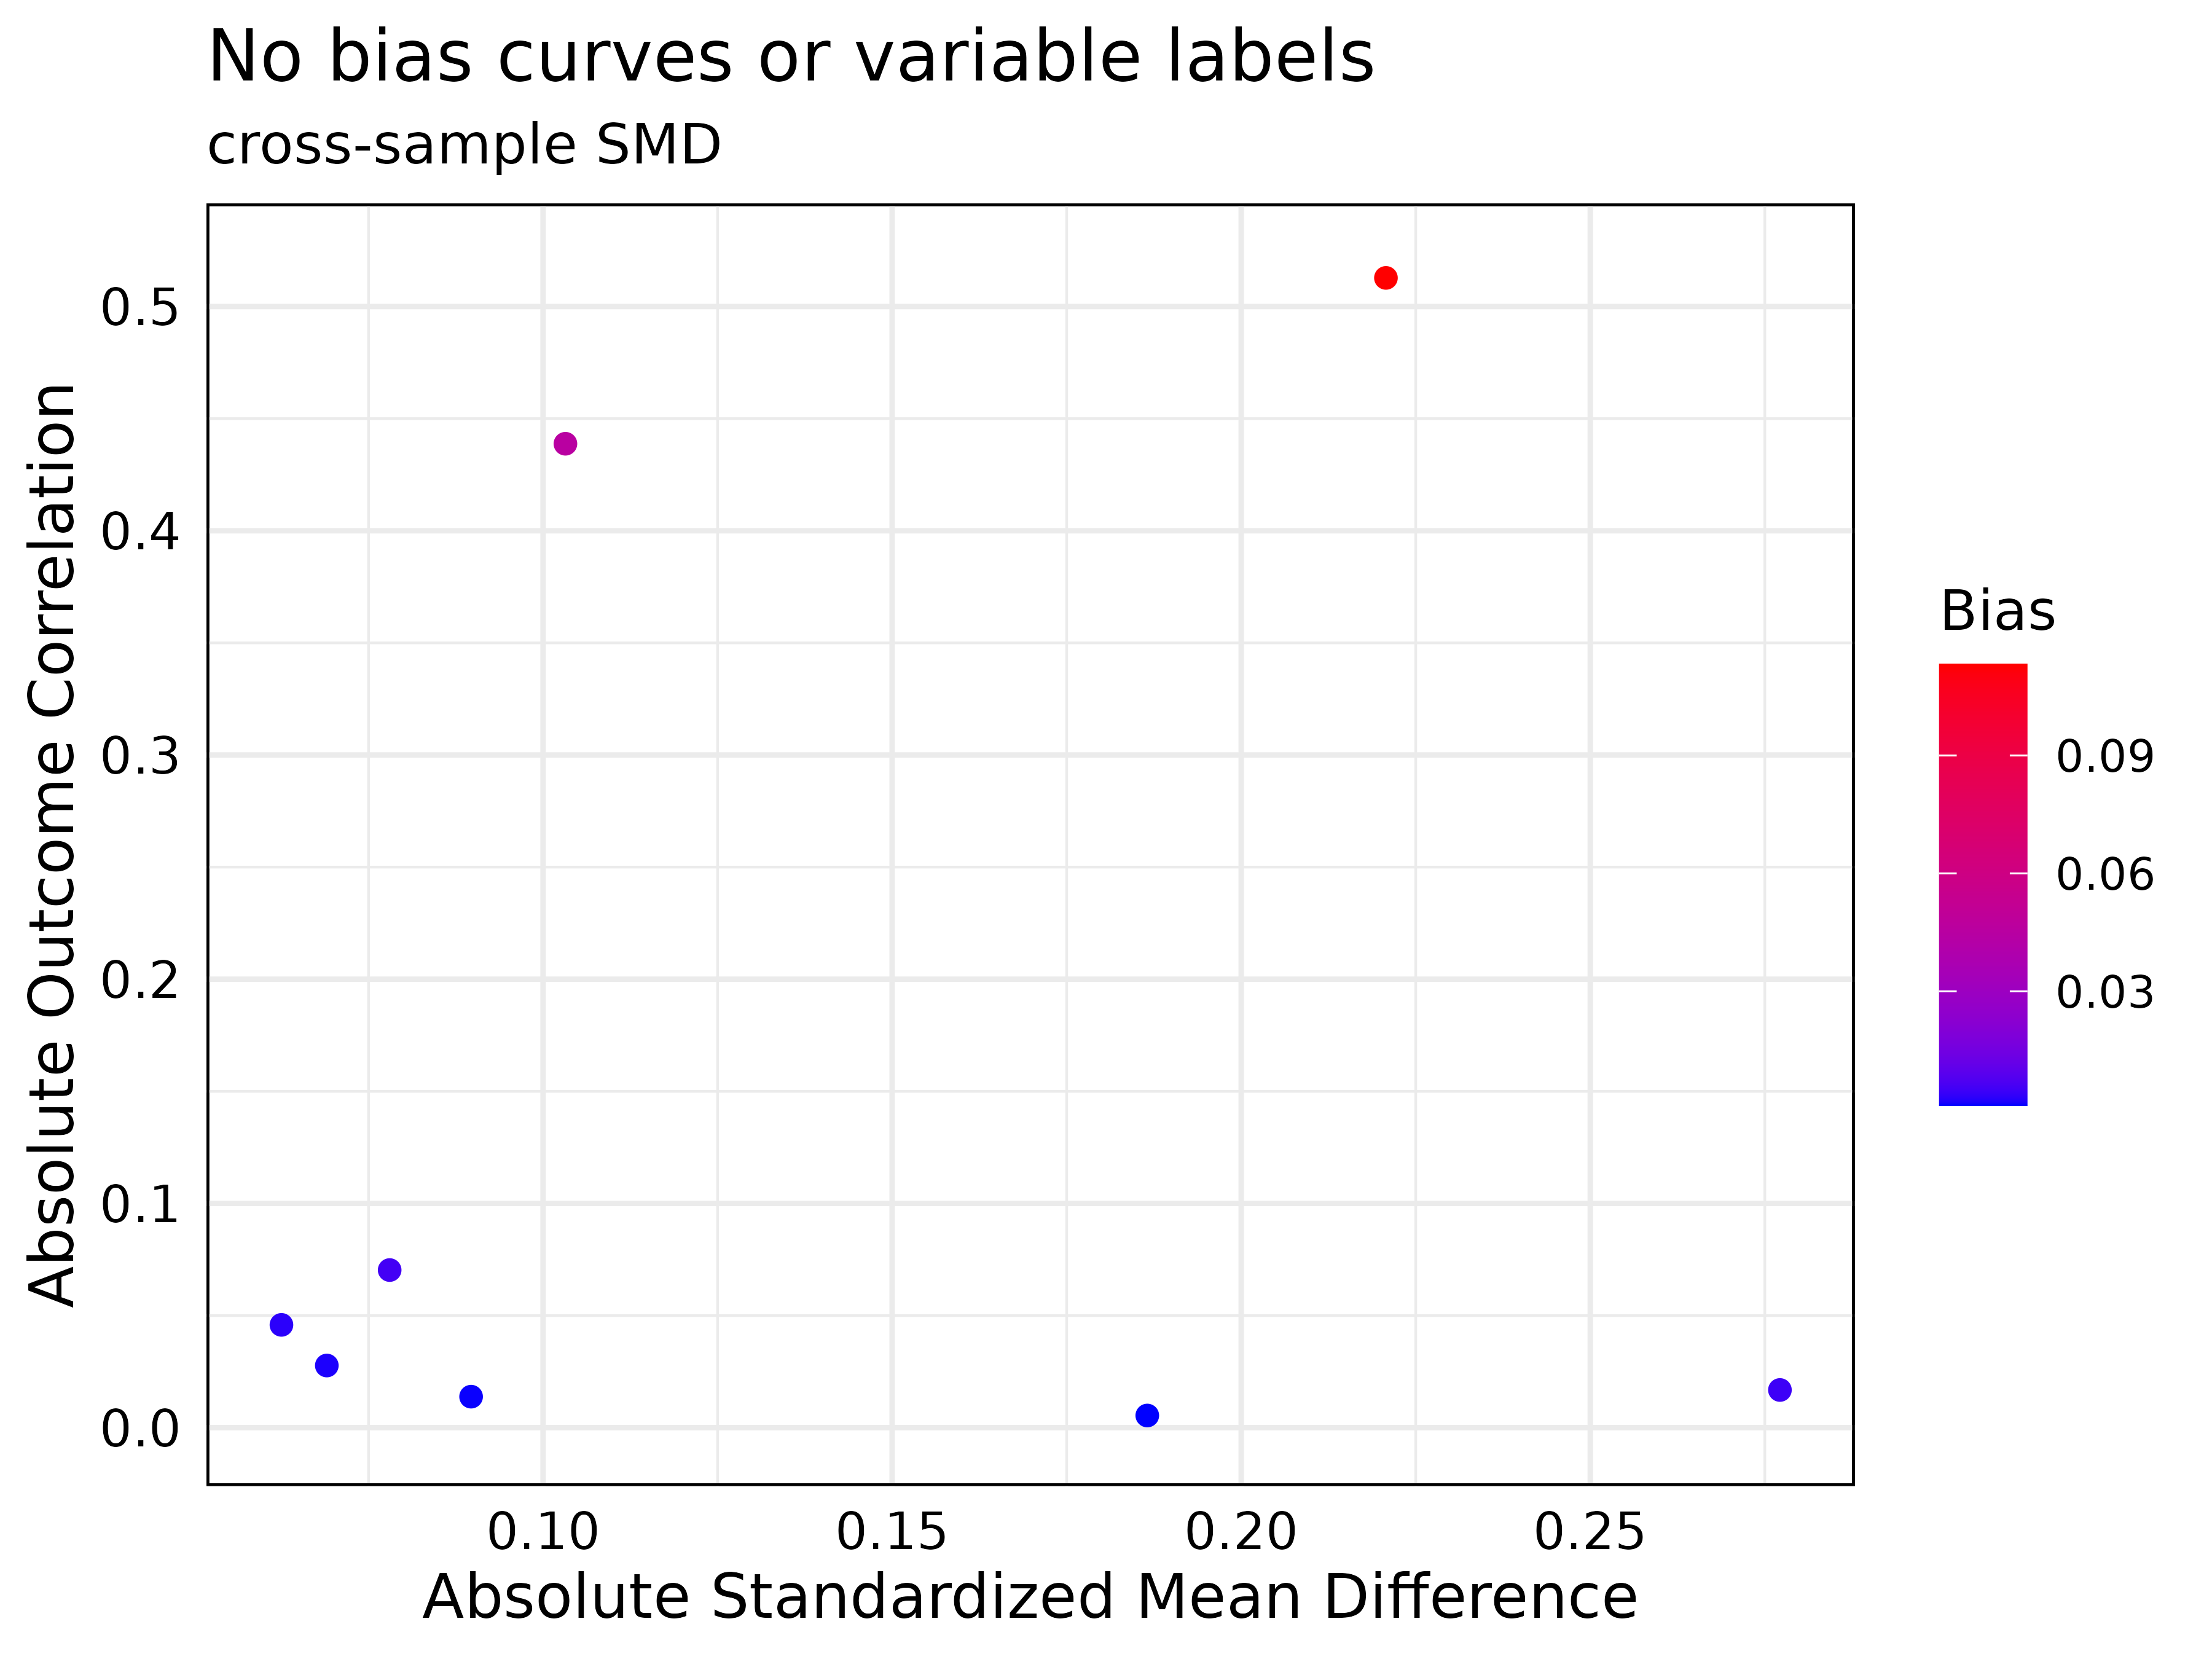
plot(new_jointVIP,
     bias_curves = FALSE,
     add_var_labs = FALSE,
     plot_title = 'No bias curves or variable labels'
     )
There are many parameters for the plot() option. The
smd and use_abs options functions the same as
above. The other main parameter input is plot_title, which
allows users to specify the title of the plot. Additional parameters not
listed as a main parameter is explained and example usage is shown
above.
-
bias_curve_cutoffs: draws bias curves by the specifications. This is only used whensmdis specified ascross-sample. -
text_size: text size of the variable labels can be increased. -
max.overlaps: maximum overlap of the variable labels. -
label_cut_std_md: standardized mean difference label cutoff, an example would be, if you wish to label all variables with standardized mean difference above 0.1. -
label_cut_outcome_cor: outcome correlation label cutoff, an example would be, if you wish to label all variables with outcome correlation above 0.2. -
label_cut_bias: bias label cutoff, an example would be, if you wish to label all variables with bias difference above 0.1. -
bias_curves: TRUE (default) draws the omitted variable bias curves, FALSE suppresses the bias curves. Ifbias_curve_cutoffsalso specified,bias_curvestakes priority. This is only used whensmdis specified ascross-sample. -
add_var_labs: TRUE (default) adds variable labels. This suppresses alllabel_cutinputs if specified FALSE. -
expanded_y_curvelab: if one wishes to expand the y-axis, the bias curve labels don’t automatically get updated. So, this allows the fine-tuning of the bias-curve labels. Typically this is used under the hood for bootstrap version of the plot. However, user can specify this if they wish. This is only used whensmdis specified ascross-sample.
Post-analysis parameters examples
The same variables are specified in the Get started with jointVIP vignette; here we choose a matching example to demonstrate the additional parameters.
Demonstration for additional options in summary() and
print()
# get_post_measures(post_optmatch_jointVIP, smd = 'cross-sample')

summary(post_optmatch_jointVIP,
        use_abs = FALSE,
        bias_tol = 0.01,
        post_bias_tol = 0.001)
#> Max bias is 0.113
#> Min bias is -0.003
#> 2 variables are above the desired 0.01 absolute bias tolerance
#> 8 variables can be plotted
#>
#> Max absolute post-bias is 0.005
#> Post-measure has 6 variable(s) above the desired 0.001 absolute bias tolerance

print(post_optmatch_jointVIP,
      bias_tol = 0.001)
#>           bias post_bias
#> log_re75 0.113     0.005
#> log_re74 0.045     0.003
#> marr     0.005     0.003
#> nodegree 0.005     0.004
#> black    0.003     0.002
#> age      0.002     0.003
#> educ     0.001     0.001
#> hisp     0.001     0.001

plot(post_optmatch_jointVIP,
     plot_title = "Post-match jointVIP using rcbalance matching",
     smd = 'cross-sample',
     use_abs = FALSE,
     add_post_labs = TRUE,
     post_label_cut_bias = 0.001)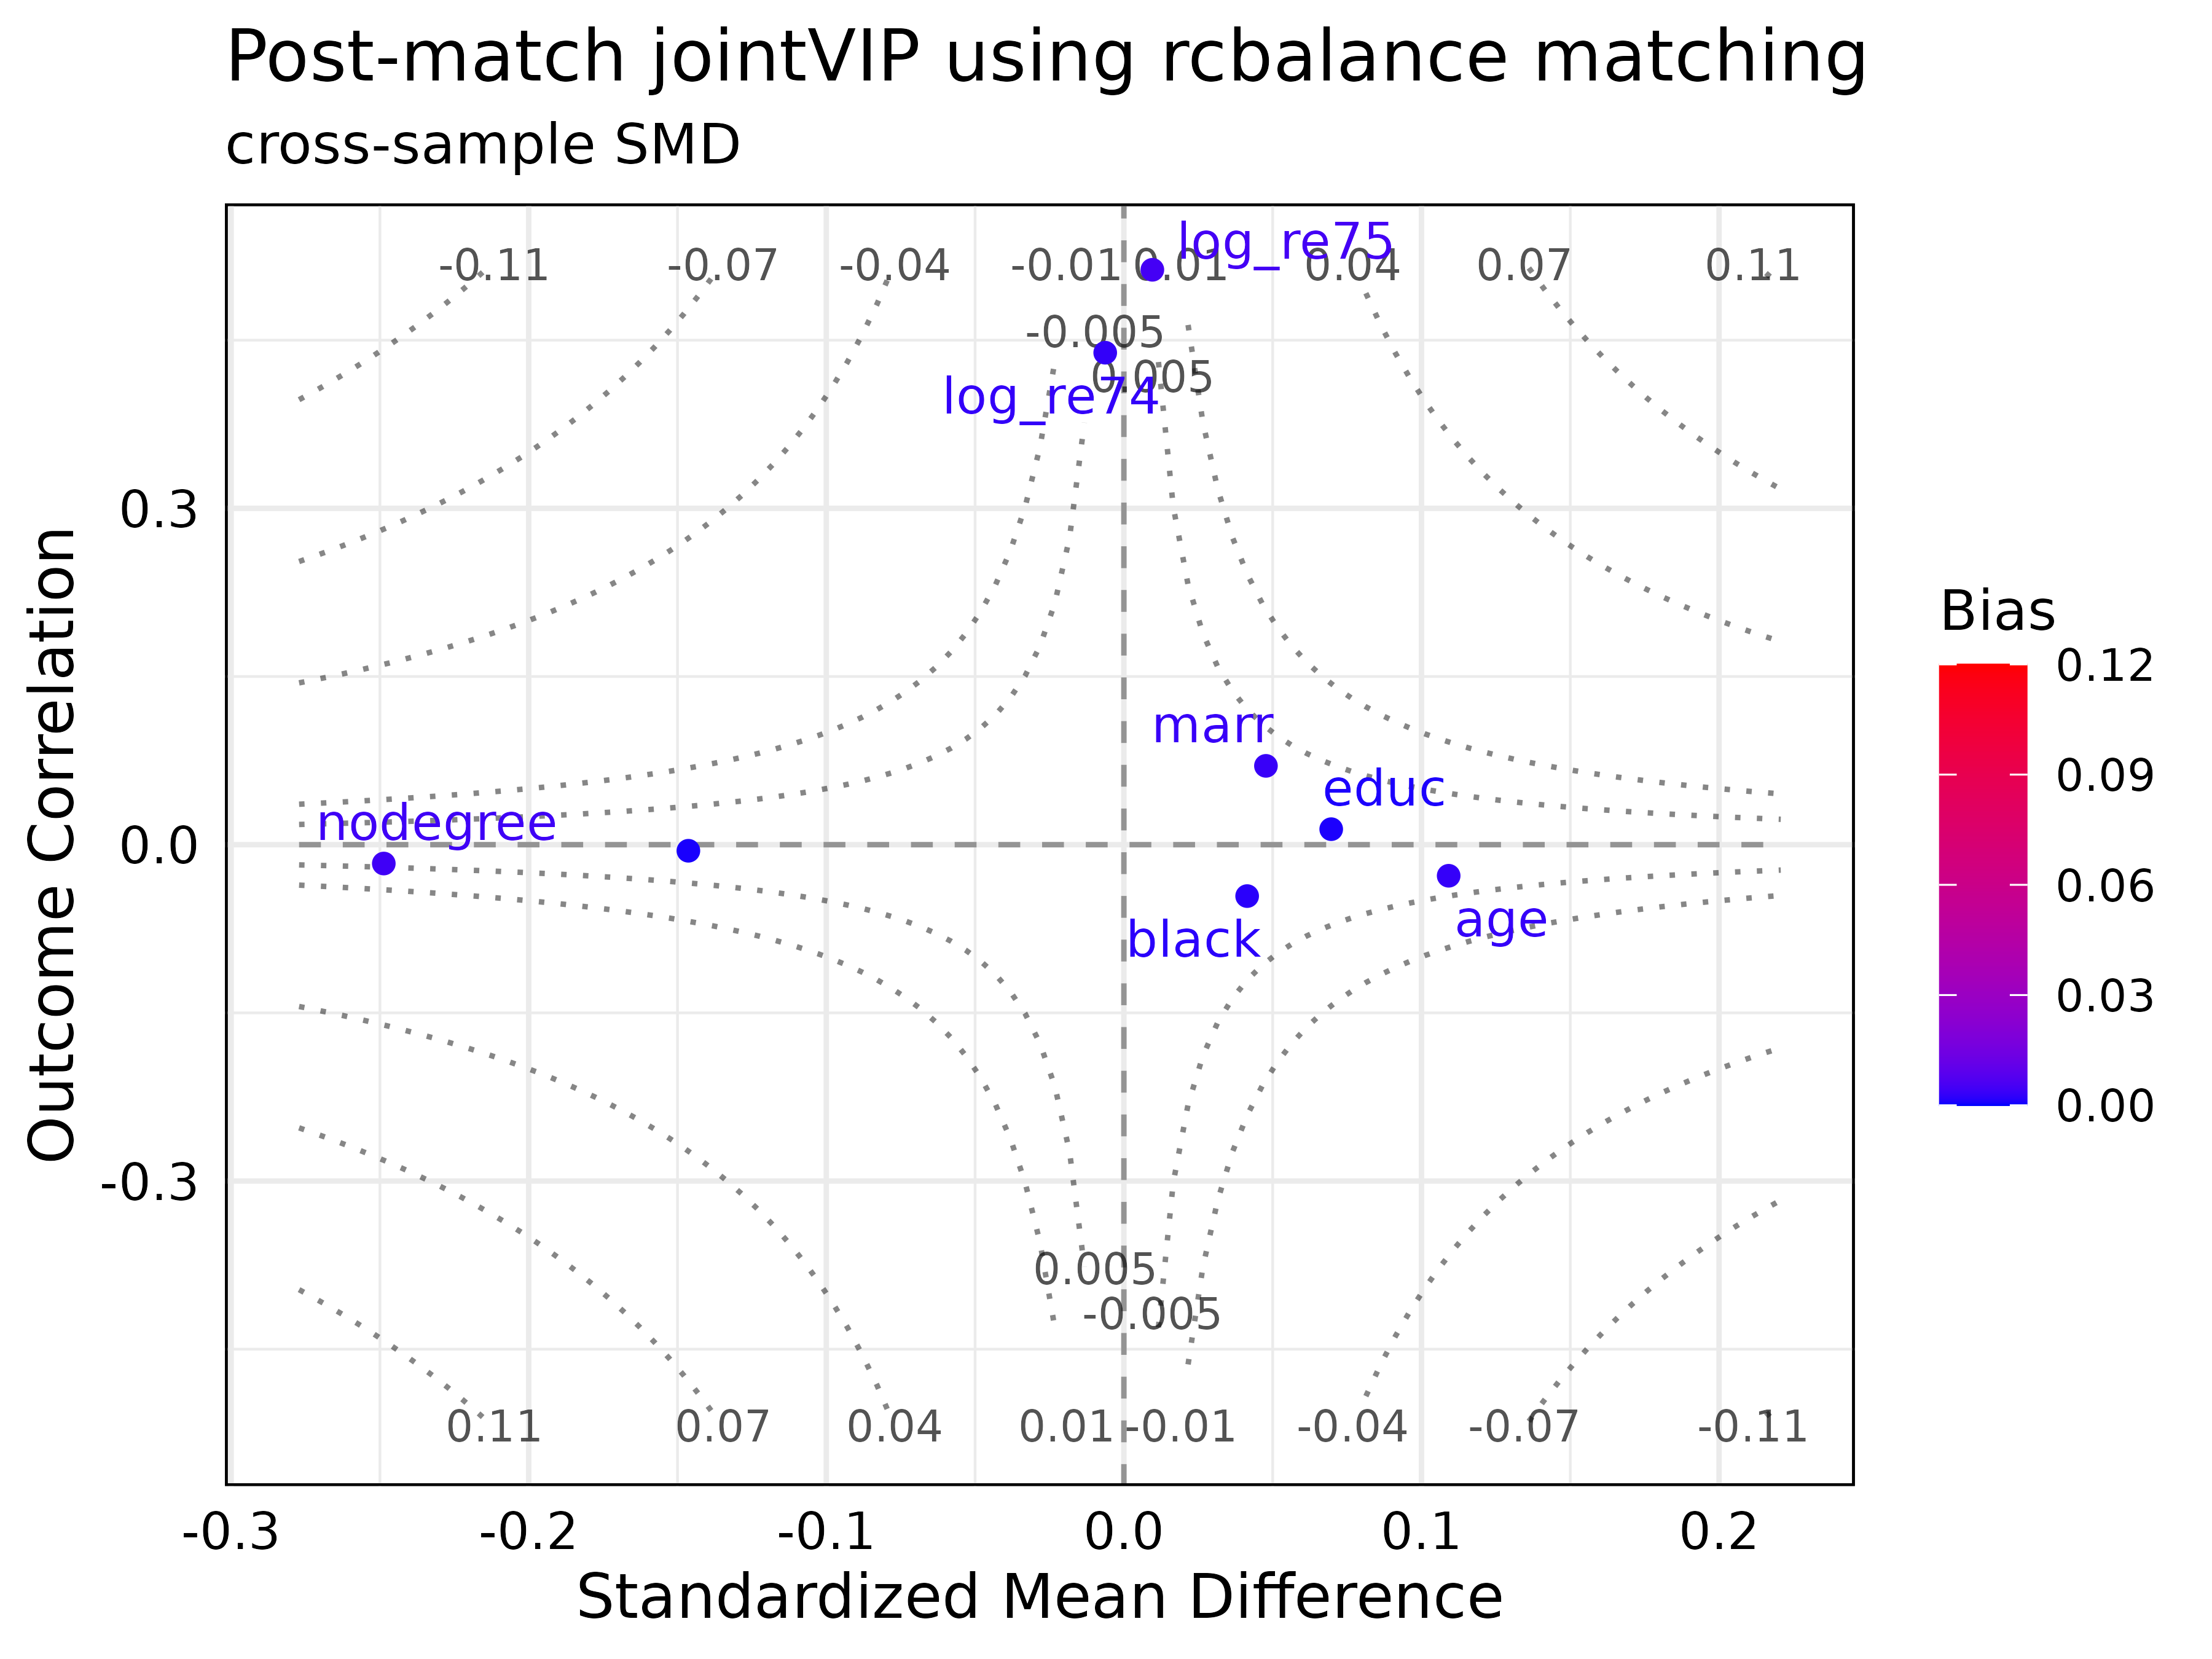
All of the options from above can be used; below will only address additional parameters or function outputs.
-
get_post_measures()takes in a post_jointVIP object andsmdspecifications for measures from the post-matched results. -
summary()function adds text output of post-match results in addition to pre-match results. Thepost_bias_tolspecifically is asummary()parameter that outputs post_bias tolerance for text comparison rounded to the fourth decimal place. -
print()function adds another column to post-match bias. -
plot()function includes two new parameters:-
add_post_labsTRUE (default) shows the variable labels post-matching/weighting; FALSE suppresses it. -
post_label_cut_biasnumeric number for variable labels; only used whenadd_post_labsis TRUE.
-