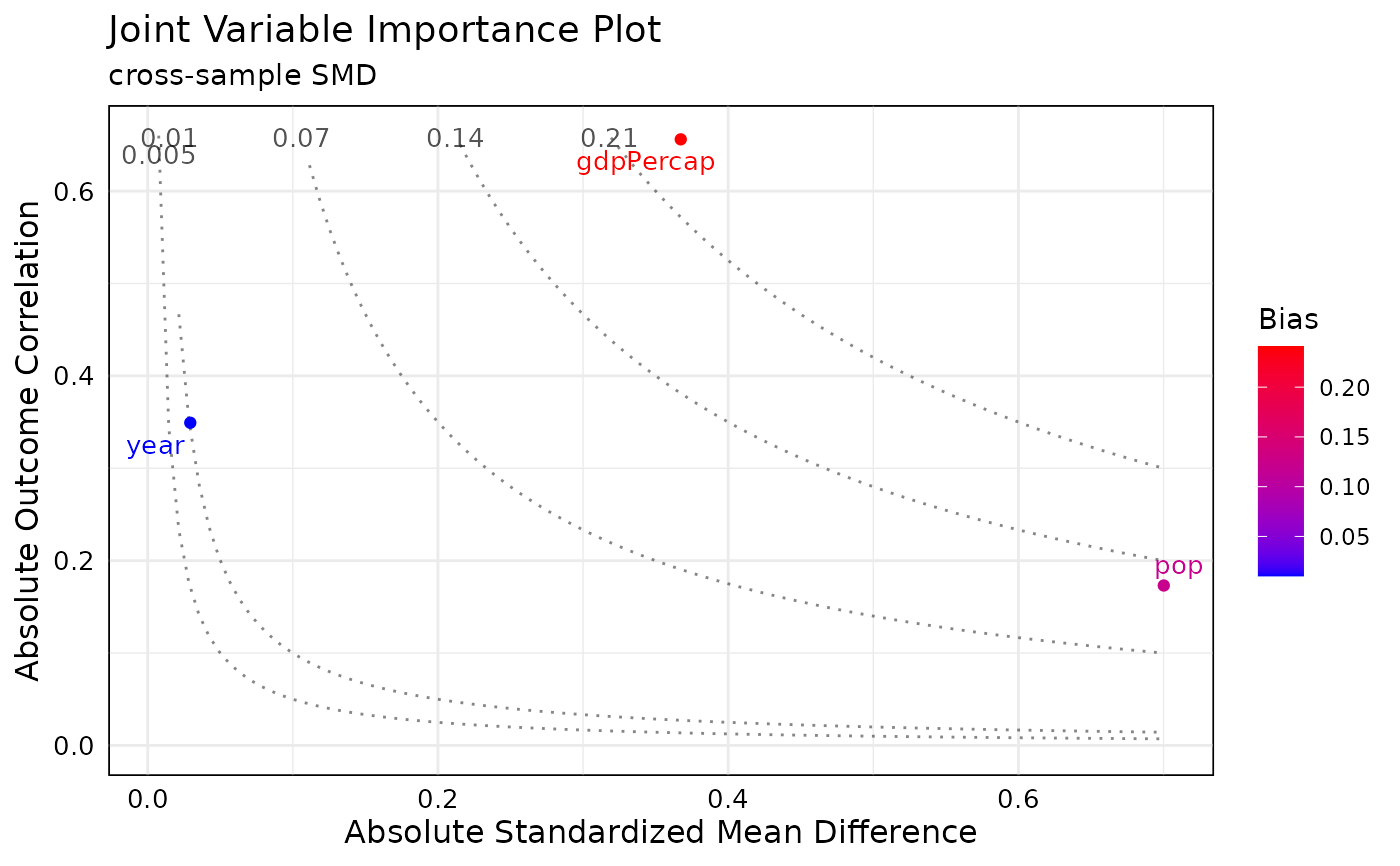
plot the post_jointVIP object this plot uses the same custom options as the jointVIP object
Source:R/plot.R
plot.post_jointVIP.Rdplot the post_jointVIP object this plot uses the same custom options as the jointVIP object
Usage
# S3 method for class 'post_jointVIP'
plot(
  x,
  ...,
  smd = "cross-sample",
  use_abs = TRUE,
  plot_title = "Joint Variable Importance Plot",
  add_post_labs = TRUE,
  post_label_cut_bias = 0.005
)
Arguments
- x
a post_jointVIP object
- ...
custom options:
bias_curve_cutoffs,text_size,max.overlaps,label_cut_std_md,label_cut_outcome_cor,label_cut_bias,bias_curves,add_var_labs,expanded_y_curvelab- smd
specify the standardized mean difference is
cross-sampleorpooled- use_abs
TRUE (default) for absolute measures
- plot_title
optional string for plot title
- add_post_labs
TRUE (default) show post-measure labels
- post_label_cut_bias
0.005 (default) show cutoff above this number; suppressed if show_post_labs is FALSE
Examples
data <- data.frame(year = rnorm(50, 200, 5),
                   pop = rnorm(50, 1000, 500),
                   gdpPercap = runif(50, 100, 1000),
                   trt = rbinom(50, 1, 0.5),
                   out = rnorm(50, 1, 0.2))
# random 20 percent of control as pilot data
pilot_sample_num = sample(which(data$trt == 0),
                          length(which(data$trt == 0)) *
                          0.2)
pilot_df = data[pilot_sample_num, ]
analysis_df = data[-pilot_sample_num, ]
treatment = "trt"
outcome = "out"
covariates = names(analysis_df)[!names(analysis_df)
                                %in% c(treatment, outcome)]
new_jointVIP = create_jointVIP(treatment = treatment,
                               outcome = outcome,
                               covariates = covariates,
                               pilot_df = pilot_df,
                               analysis_df = analysis_df)

## at this step typically you may wish to do matching or weighting
## the results after can be stored as a post_data
## the post_data here is not matched or weighted, only for illustrative purposes
post_data <- data.frame(year = rnorm(50, 200, 5),
                        pop = rnorm(50, 1000, 500),
                        gdpPercap = runif(50, 100, 1000),
                        trt = rbinom(50, 1, 0.5),
                        out = rnorm(50, 1, 0.2))
post_dat_jointVIP = create_post_jointVIP(new_jointVIP, post_data)
plot(post_dat_jointVIP)
#> Warning: Color not scaled to previous pre-bias plot since the post-bias is greater than pre-bias
